In this edition we want to update you on the development of a possible important low for live cattle and feeder cattle futures. If we are right with our analysis of futures markets, cash markets could also form bottoming formations in some areas of Canada and the US.
We concentrate today’s analysis on the charts. Some folks would be skeptical of using chart patterns to develop any kind of realistic analysis, but we feel the charts sometimes form useful pictorials of hard-to-evaluate and complicated fundamental forces.
In particular, feeder cattle are showing interesting chart patterns. Let’s start with a short-term zoom. The Oct. feeder future recently broke up out of a down sloping wedge formation, as shown on the chart below.
That might not seem important, but as chart-watchers, we can say that when a market pops out of a wedge, it can sometimes run quite some distance.
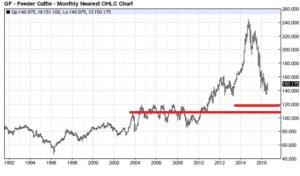
What’s more, this formation is evident on the weekly chart too. Let’s zoom out for longer-term perspective (below).
Look at the weekly feeder chart going back to the great super-cycle peak of the market in the fall of 2014. You can see a move up out of wedge here too. This is one formation that we keep an eye out for. The pattern is especially interesting when a market is cheap. It seems the choppy pattern in past months was amid an atmosphere in which the market was low and kept trying to go lower but lost its downward momentum from the previous couple years.
Bear in mind, the break by nearby feeder futures to the $130 area, which occurred this summer, put the market down into a zone of long-term chart support identified in a previous posting. As you might remember, our post in late May said one area of chart support for feeders sat at roughly $133 – the approximate lows seen in 2012 and 2013 – with a second more significant support zone at $120.
A minimum upside objective for a small bounce might be roughly $160 but given the real estate the market lost the past couple years, it wouldn’t be terribly shocking if the bounce is more than that.
Someday, odds are good the market will visit the lower level of support around $120 but that might not happen until some distance out in the future, such as a couple years or longer.
Added thought: With the futures and cash markets down something in the neighborhood of $110/cwt from the peak of October 2014, is it really any surprise that the market seems to be sending the message it’s had just about enough?
This article was written before the release of the USDA August crop report. It could be that the feeder market would like a bearish crop report. If the US corn yield and production is above trade expectations and corn futures drop in response, feeder values could get an added boost. If the opposite happens with a smaller crop than expected and higher corn futures, it won’t be so easy for feeders to keep moving higher. Corn is a real wild card in the mix of fundamental factors.
Some would say chart perspectives are whimsical thinking and others would suggest they’re basic common sense.
The corn market could have a lot to say in how you look back to categorize this analysis.
By John DePutter and Dave Milne, DePutter Publishing Ltd.
Brought to you in partnership by: